U.S. hotel performance data for 8-14 June came in lower than projected with a third straight week of hotel demand declines at a time when the early-summer travel season was expected to lift performance.
Like any time when increases or decreases begin to form a trend, it’s important to go beyond national averages and dig deeper into the market segments as the story is not the same across the board.
Steepest decline in two regions
Recent weeks have shown flat demand in much of the country but significant declines in the Mountain and West South Central regions. The former is mostly Las Vegas, which was experiencing a step drop-off in international arrivals as of May (source: I-92). The latter can be largely attributed to tough year-over-year comparisons in Texas after last May’s derecho—especially in a major market like Houston. Through the first two weeks of June, Houston and Las Vegas accounted for 32% of the absolute room demand decline among all markets that reported a loss.
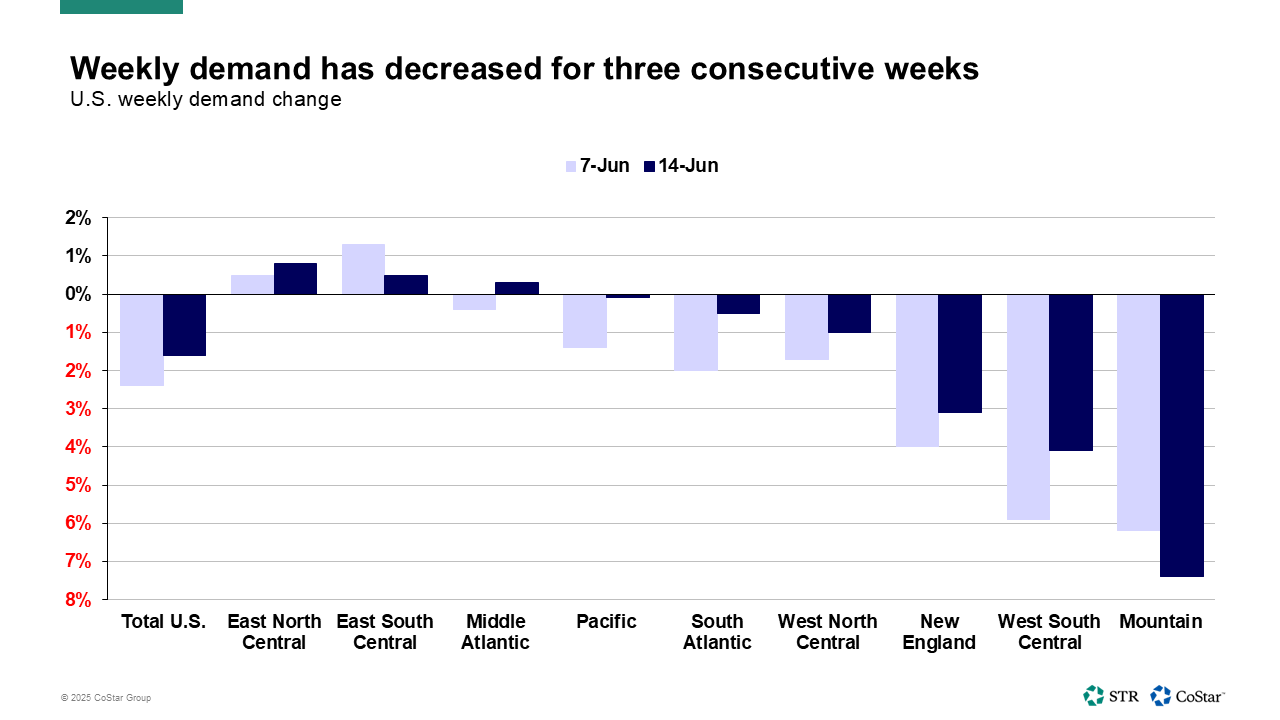
On the positive side, 61 of 172 U.S. markets are seeing June MTD demand gains, led by five markets: Chicago, Nashville, Oklahoma Area, Orlando, and Saint Louis. These five accounted for 32% of the absolute growth among those markets reporting June MTD demand gains.
For the total U.S., markets losing room demand lost 1,588,000 room nights, offset by markets gaining demand (552,000) for a total loss of 1,036,000 room nights June MTD.
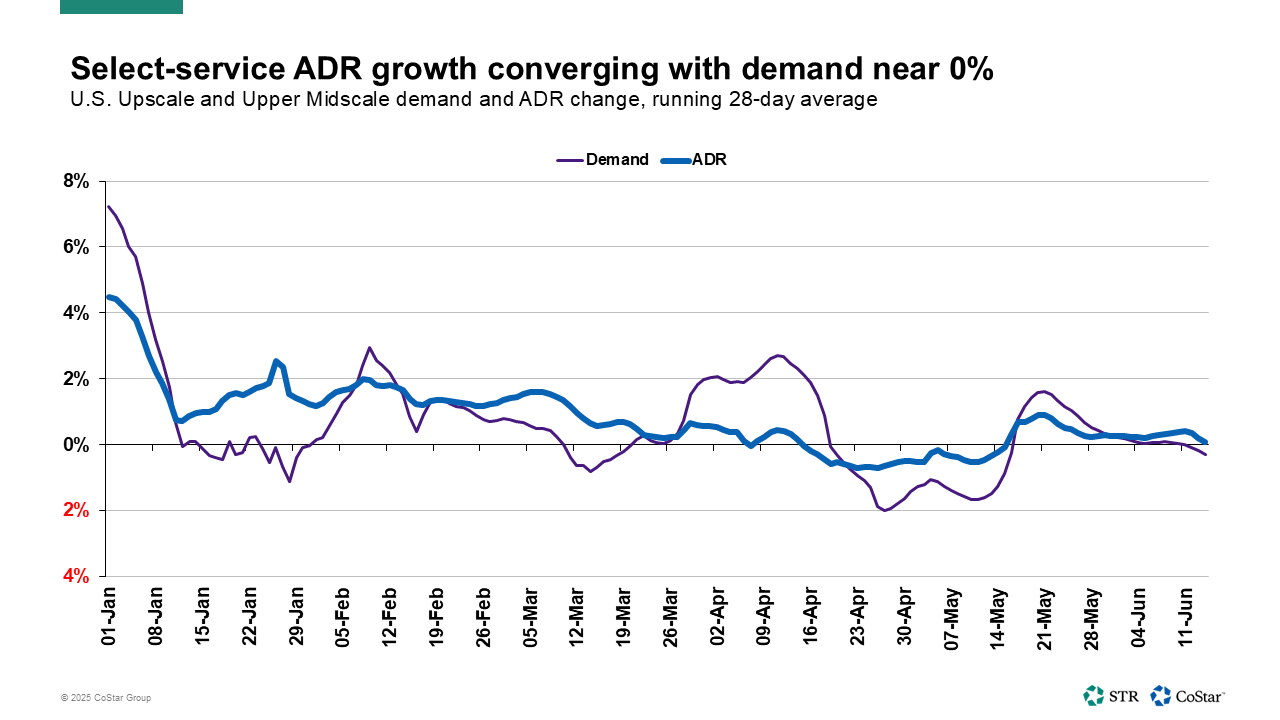
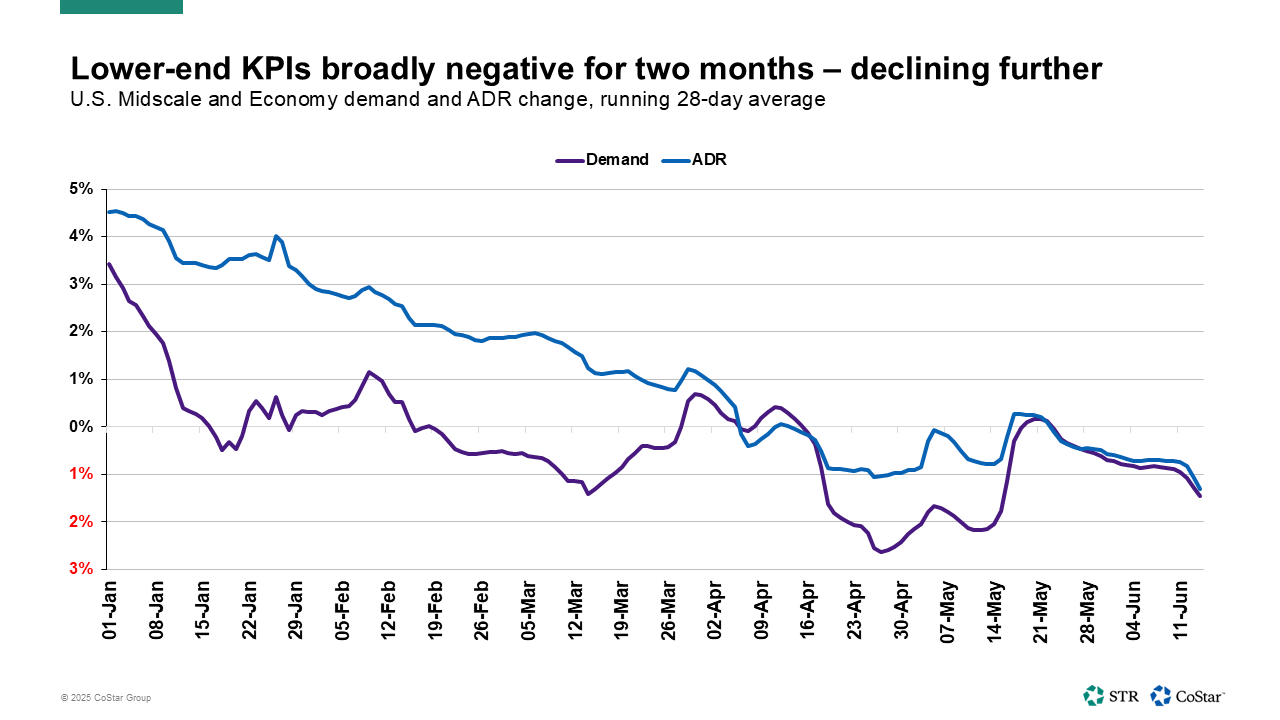
Downside risk with ADR
Growth in average daily rate (ADR) has softened, especially in the select-service segments. We have referenced ADR as a downside risk to the forecast we released in early June.
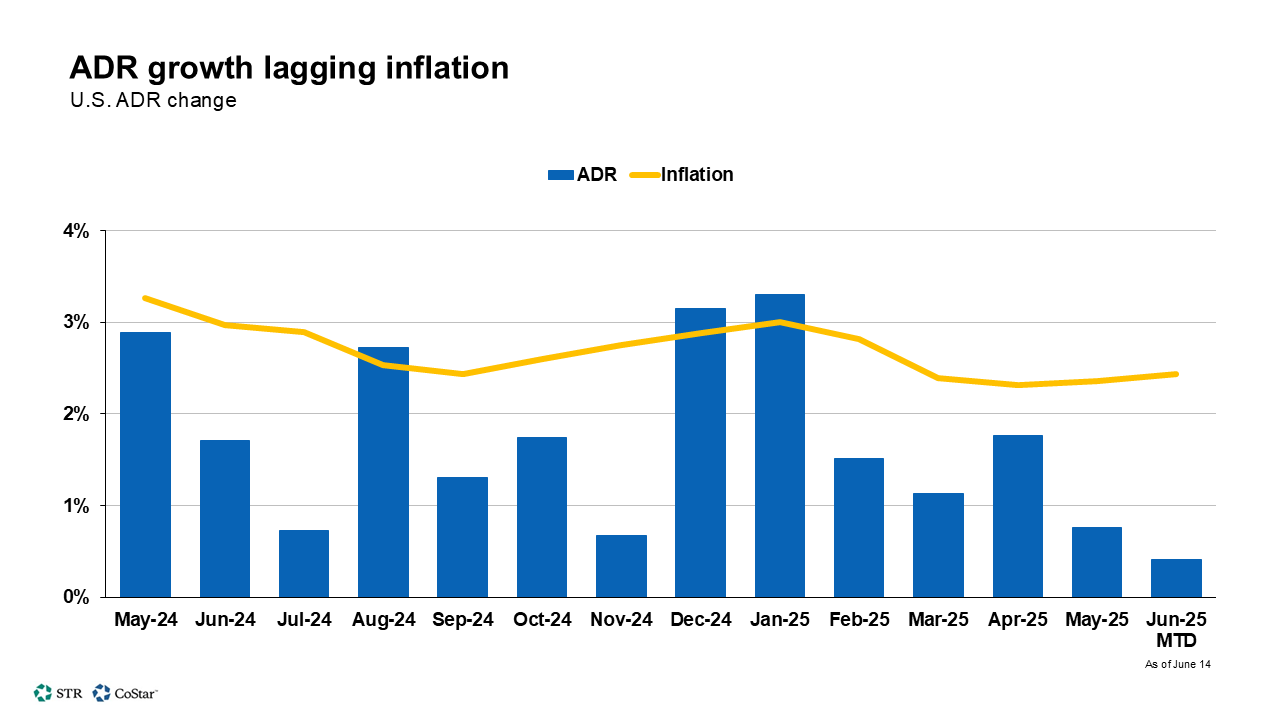
Monthly data through May shows ADR growth converging with demand near 0% in the Upscale and Upper Midscale segments with declines in Midscale and Economy.
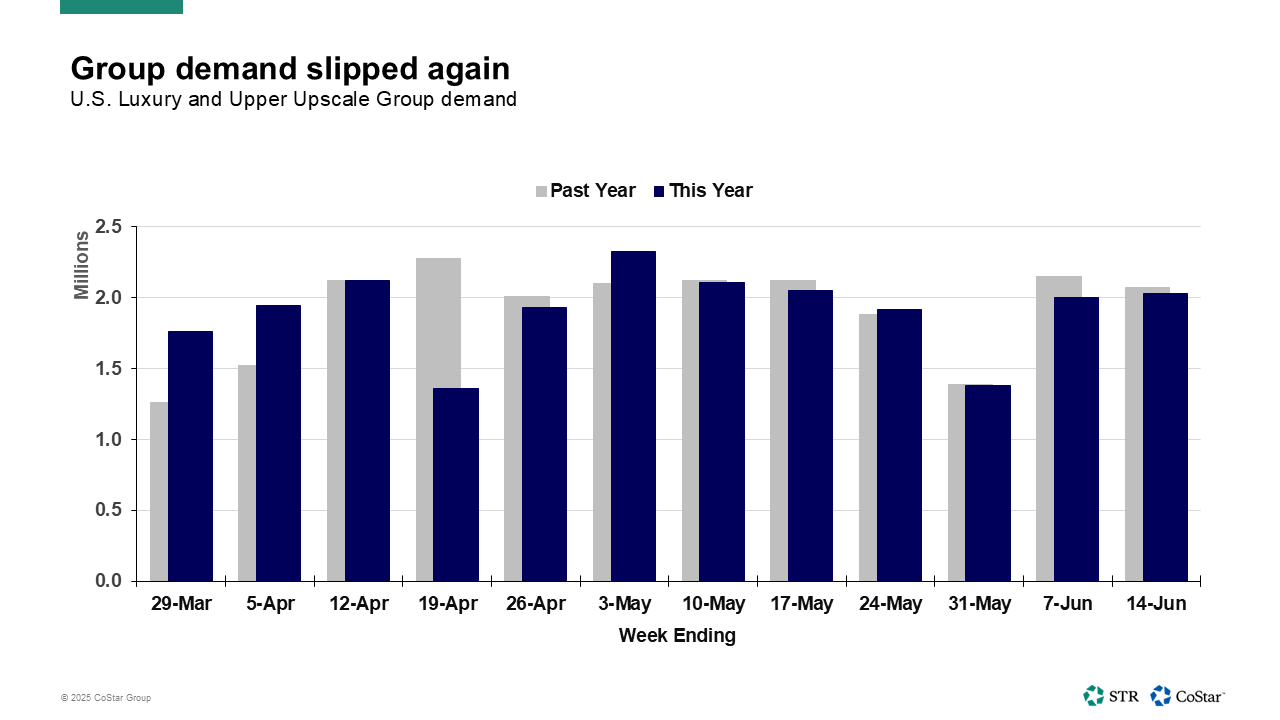
Summer bookings and Group business
Forward booking data in the Top 25 Markets has remained positive for June and showed the impact of shorter booking windows with levels improving as stay dates draw nearer for much of the summer.
However, not all markets are converting at the same rate. In the week ending 14 June, for example, there were noticeable percentage-change differences between occupancy on the books and actualized occupancy in markets like Las Vegas, Houston, Philadelphia and Orlando.
One possible reason for that gap is Group room blocks not matching expectations, especially with international travelers. U.S. Group demand has dipped year over year in three consecutive weeks, but that is not enough of a sample to be considered a trend.
As we have noted, Group bookings have been resilient in recent years, so any sustained downturn would warrant a reevaluation of the overall demand outlook.
Travel indicators
International inbound was the focus of one of our recent analyses with declines earlier this year and a subsequent downgrade in projections from Tourism Economics. International arrivals account for an estimated 4-7% of U.S. hotel demand. Thus, the impact of any decline on hotel demand is on the lower side considering the U.S. sells more than 1 billion-plus room nights annual. Over the first five months of 2025, international arrivals were down 3.1% (source: I-92). At the same time, 3% more Americans traveled abroad.
TSA screenings have fallen for the past three weeks ending 14 June. However, for the week ending 21 June, screenings increased 0.1% year over year. Additionally, on Sunday, 22 June, screenings reached their highest level ever recorded. Of the top 10 highest screenings to date, five have occurred this year: 22 May, 23 May, 19 June, 22 June and 23 June.
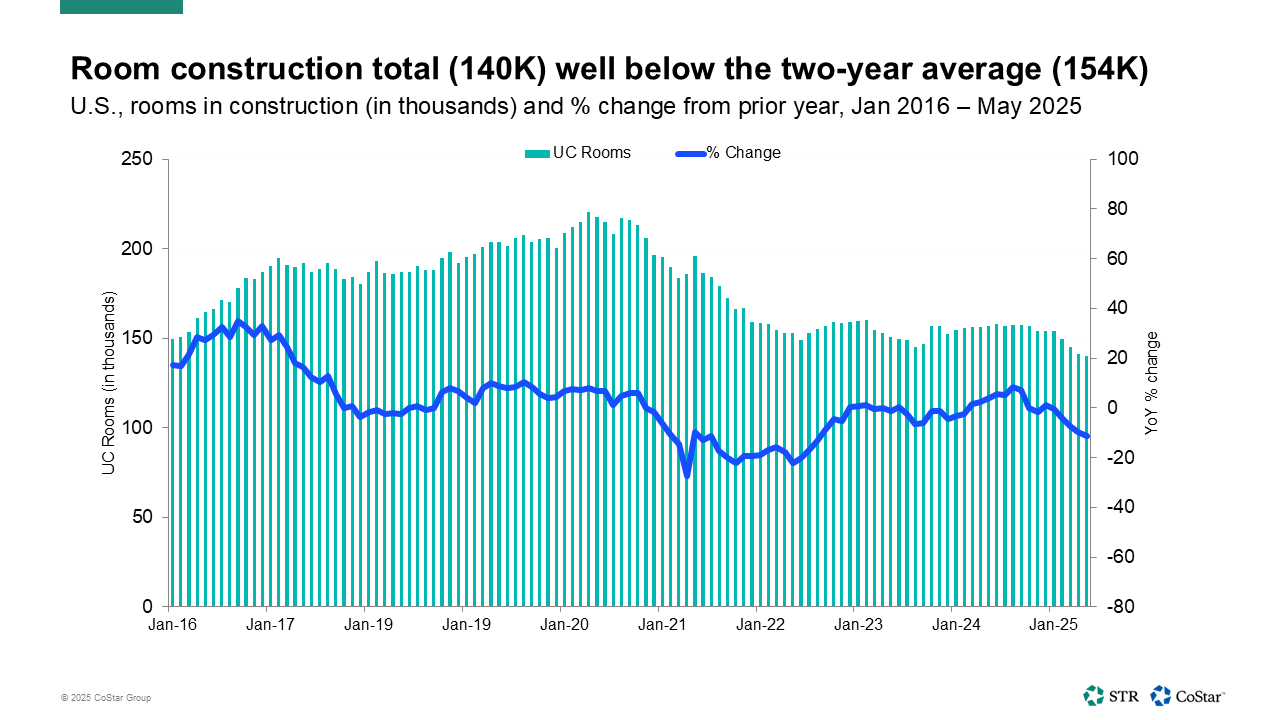
Supply growth not a major factor
While there are market-level exceptions, supply growth has not added significant pressure on performance. That’s likely to remain the case for some time. However, at +0.8% through the first two weeks of June, month-to-date supply growth was the highest it has been since July 2022. Markets seeing the most absolute new rooms added include Nashville, New York City, Orlando, San Diego and Washington, DC. Together, these five account for 22% of the total number of rooms added to the industry as of June MTD.
With more companies waiting on the impact of tariffs and potential movement in interest rates, fewer projects are breaking ground. A lot of projects are remaining in the planning phases, and we’ll be watching those closely as that is where economic pressures are most likely to be impactful. Projects already in construction are highly likely to be completed regardless.
Looking forward
As we have heard from clients and observed in forward-looking data, uncertainty is pushing travelers to book in shorter windows. Leisure travelers acting in the coming weeks will be key to shifting the demand and ADR trend lines in a better direction. Consumer confidence was a key factor in our recent forecast downgrade, and leisure gains were expected to be more isolated around major events. ADR growth has remained the driver of top-line performance, which is why there is more downside risk connected to rate than demand.